
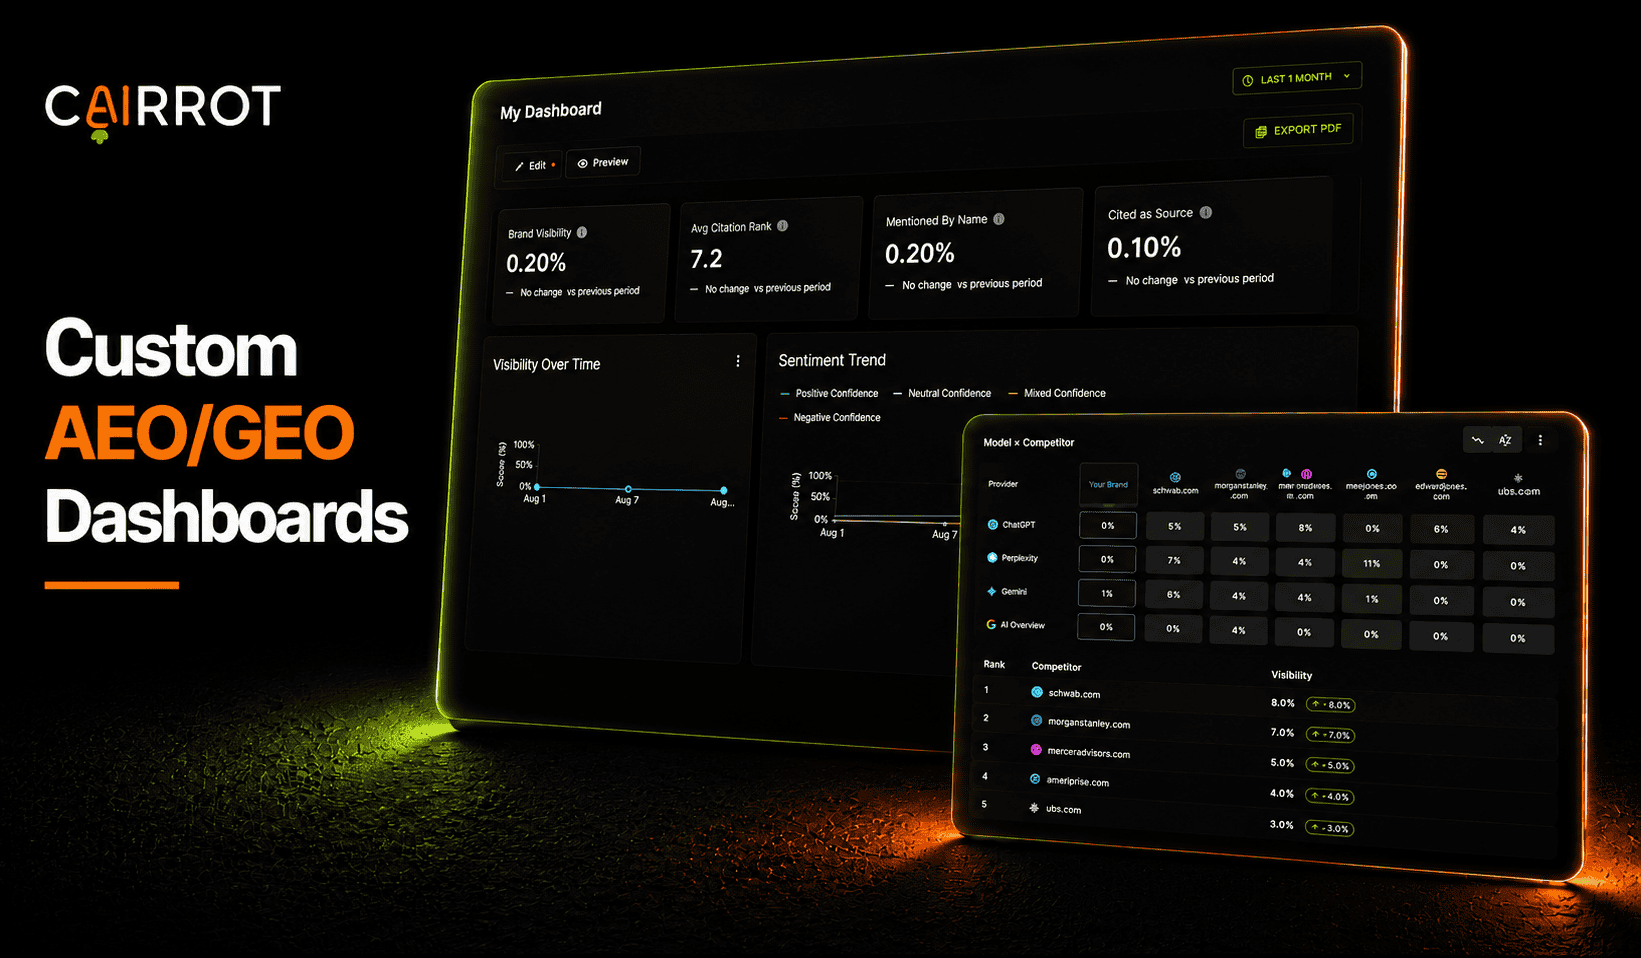
What is a custom dashboard and how does it work?
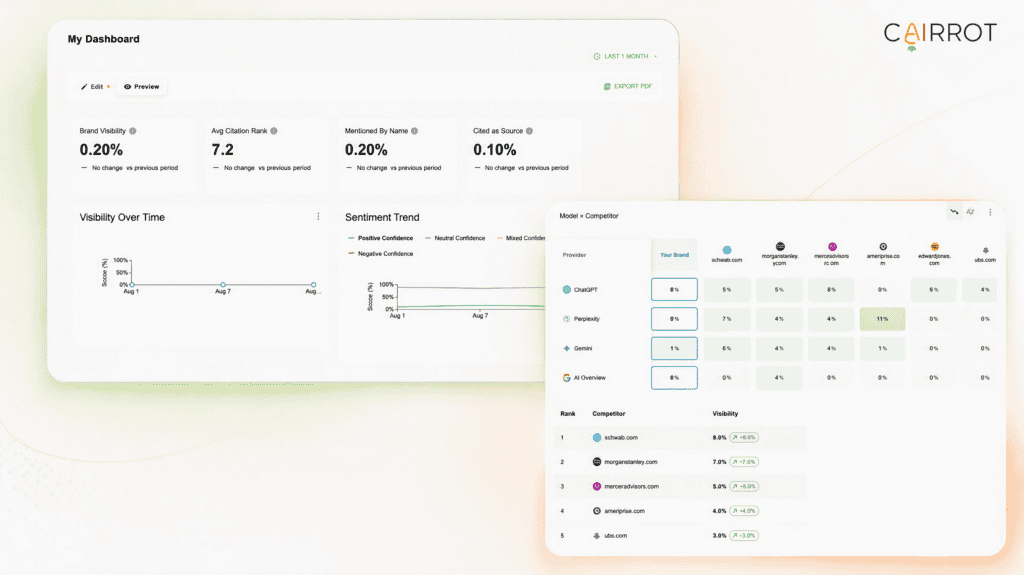
A custom dashboard is a screen you build yourself to view your AI visibility metrics. Instead of opening six reports to find four numbers, you pick your widgets, drop them on a grid, and save the view. It reads from the same data as every other report in your account, your visibility, mentions, citations, competitors, sentiment, crawler hits, and AI traffic. The only difference is that you decide what goes on the screen and in what order.
Best practices:
- Build one dashboard per audience, what you check daily is not what a client wants to see
- Put your headline KPIs across the top row, that is where the eye lands first
- Keep it to one screen, if you have to scroll it stops getting checked
Building and monitoring a custom AEO dashboard
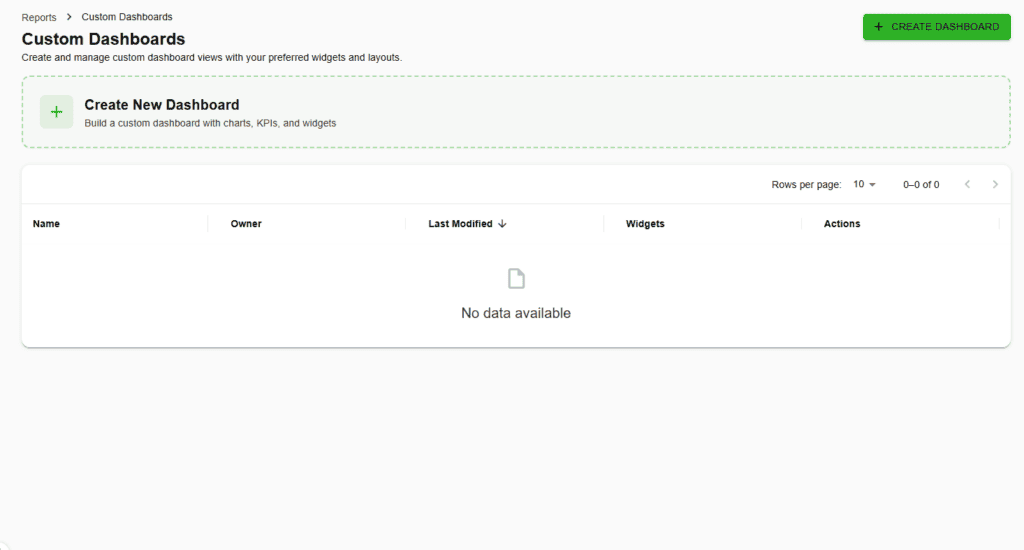
Head to Reports in the left sidebar and pick Custom Dashboard. You’ll see every dashboard you’ve already built listed out with the owner, when it was last modified, and how many widgets it holds. Hit Create Dashboard to start a fresh one.
Open the widget catalog
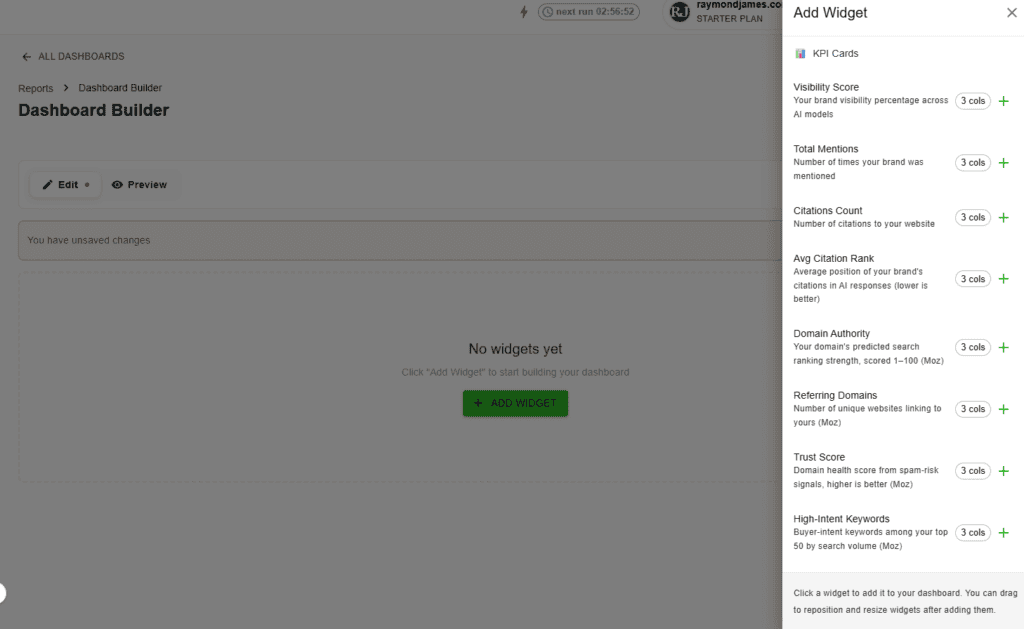
Click Add Widget and the full catalog slides out on the right. Everything is grouped into KPI Cards, Timeline Charts, Heatmaps, Gauges, Tables, Pie Charts, Bar Charts, AI Traffic from Google Analytics, and Text Elements. Each widget shows its default width in columns before you add it, so you know how much of the row it’s going to take.
Pick the KPIs you want to monitor
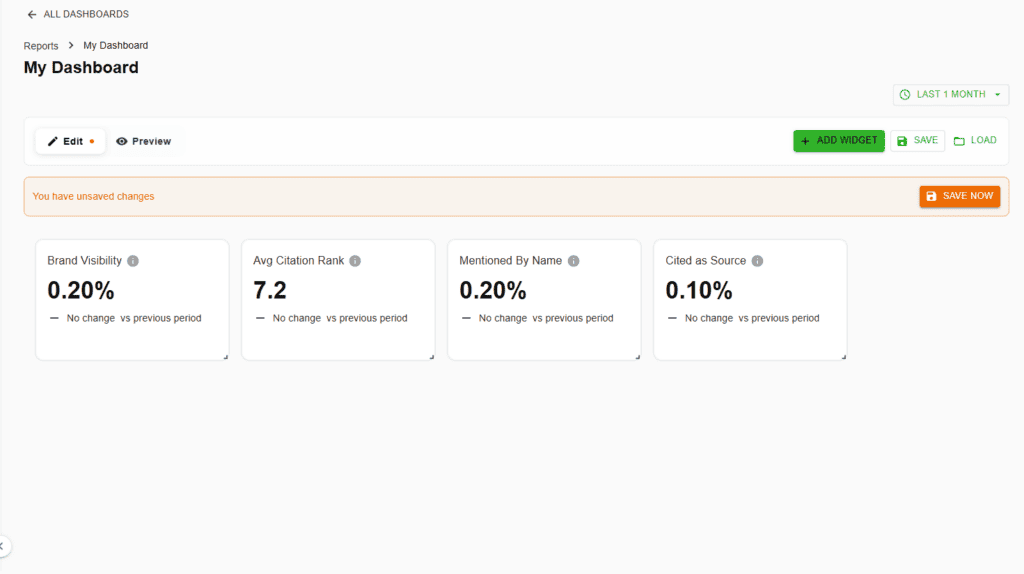
I started with Visibility Score, Total Mentions, Citations Count, and Avg Citation Rank. There are also cards for Domain Authority, Referring Domains, Trust Score, High-Intent Keywords, and AI Crawler Hits if your client cares about the authority side of things.
Add your charts, tables, and heatmaps
Under that, drop in Visibility Over Time and Sentiment Trend at 6 columns each, then Competitor Leaderboard https://cairrot.com/features/aeo-competitor-analysis/and Top Prompts on the row below. If you want the whole picture on one screen, the Topic x Competitor heatmap runs the full 12 columns and shows you which conversations you own versus everyone else.
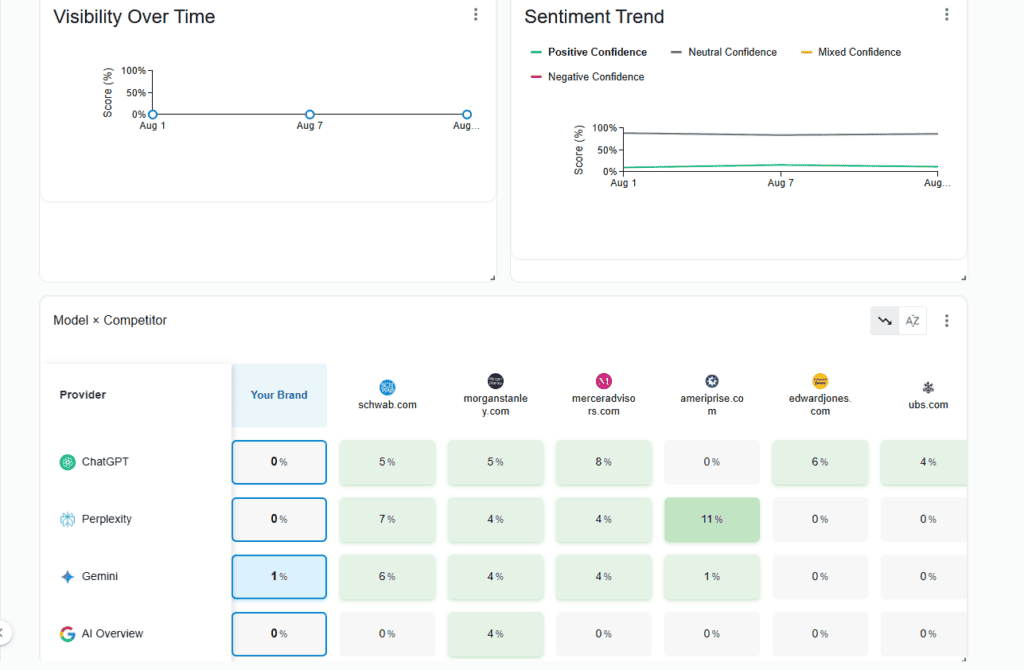
Arrange dashboard to liking
Drag any widget to reposition it and pull the corner to resize. There’s a Section Heading widget under Text Elements if you want to break the board into labelled blocks. Flip between Edit and Preview whenever you want to see it the way a client will.
It shows up in your Custom Dashboards list, and the Load button pulls any saved dashboard back into the builder. The date range picker at the top right applies to every widget at once, so you can swing the whole board to last 7 days or last month in a single click.
FAQ
Is the custom dashboard included in every Cairrot plan?
Yes, every paid Cairrot plan includes the Dashboard Builder and you can save as many dashboards as you need.
What can I put on a custom dashboard?
Anything Cairrot already tracks, visibility, mentions, citations, competitor rankings, sentiment, crawler hits, and your AI traffic from GA4.
Can I build a different dashboard for each client?
Yes, you can build as many dashboards as you want.
Build your AI Tracking Dashboard
Create your custom dashboard in minutes. Pick your widgets, save the view, and open one screen instead. It’s included in every paid Cairrot plan, and you can start with a free AEO report.